
Something bad is happening to the River Mole: shocking increase in pollution levels across the catchment!
- Aug 1, 2024
- 10 min read
Updated: Apr 24, 2025
Our citizen scientists were out testing again across the whole River Mole catchment at the end of July. Worryingly for wildlife and people, the results show a shocking increase in pollution levels in the River Mole this month.


The chart below shows how pollution levels in the main channel of the River Mole have taken a shockingly steep upturn through July with levels in the catchment far exceeding the equivalent last July or indeed anything we have tested before.

In particular, test sites between Horley and Leatherhead on the main channel in the Upper Mole recorded very high readings. These results place the river firmly in Bad water quality status. Whilst increased pollution concentration is expected in low river flows during summer, it is worth noting that the highest pollution concentration reached last summer was in August, a month later. We are therefore concerned how much higher these damaging levels might climb with another month of summer still to go.

The summary chart above shows test results downstream for collated sites through the catchment. July results are shown as red stars. The elevated concentrations for July can easily be seen particularly along the middle section of the Upper Mole from Gatwick Stream Horley through West Vale, Sidlow Bridge to Dorking and through the Mole Gap including the iconic Stepping Stones at Box Hill. This section of the main river would be classified as BAD water quality. It is a shocking development for entire sections of the main River Mole channel to deteriorate to such damaging levels of BAD water quality status.
Indeed, the average Phosphate concentration for the entire catchment from our July tests was 1.23ppm which is puts the whole catchment into the POOR water quality range and closely approaching BAD. This is shocking news for the river, its wildlife and the people who love it and play around it and even in it.

Important test sites on the main River Mole channel that recorded BAD water quality include the Gatwick Stream at Horley, River Mole at Castle Mill and the Stepping Stones at Box Hill. These locations are famously used for paddling and playing frequently by families with children.. and why shouldn't they enjoy the water? Unfortunately, the pollution levels we recorded are indicative of serious underlying damage to aquatic ecosystems and also may potentially indicate a risk to human health. Please note on this occasion we did not carry out bacterial or E.coli tests but we are doing these soon across key sites on the catchment.. results will be published here. Meanwhile, please follow sensible safety precautions if playing in or near the river or if in doubt avoid it completely. (see advice from Rivers Trust at foot of this post)


The chart below shows the new record average for the catchment as a whole in relation to river discharge. As river discharge is lower in summer so the concentration of pollutants goes up. This expected trend hides the enormous surge in pollution we have seen this month especially in the Mid-Mole south of the Mole Gap but the whole catchment is suffering elevated levels into the Poor water quality range.

The GIS map below shows key hot spots of phosphate pollution from our citizen science tests. Notice the large red blobs in the Upper Mole around Redhill, Reigate, Dorking and Horley. The main channel is recording especially high pollution levels.. off the scale of our low range Hanna kits showing "BAD" water quality in most rivers and streams in this area of the middle Upper Mole.

A focus on one tributary: Leigh Brook is essentially "dead"
We recently conducted a focussed high resolution study with the help of our partners at River Mole Catchment Partnership testing a variety of parameters along the entire Leigh Brook. Our tests reveal this stream to be essentially "dead" from excessively high pollution. Elevated levels of phosphate were as high as 15ppm. It also contained toxic ammonia levels as high as 5.66ppm NH4+ -N mg/l (ammoniacal nitrogen) and low BOD. Our Ammonia Hanna kits tested 3ppm. We tested downstream of the Holmwood sewage treatment plant outfall, a known treatment works with serious failings. Unfortunately this sewage treatment works provides almost the entire discharge of the brook during low summer flow. Downstream of this outfall the toxic levels of ammonia and phosphate we recorded were almost certainly above permit levels.. we are in the process of confirming this.

Our full test results will be published in due course but this stream, like too many tributaries in the Mole catchment, are fed by failing sewage works that release treated effluent damaging to aquatic life and river ecosystems. Rivers are subjected to discharges of poor quality treated effluent that are a slow death for our streams. The discharge of treated effluent which occurs all day everyday is in many ways far more important than the occasional, but too frequent, release of untreated sewage in storm overflows.
Which streams are the cleanest?

Perhaps a few tributaries show us what the River Mole could be like without the abuse of human activity. Shag Brook near Reigate has consistently recorded fairly low levels of phosphate pollution staying in the High or Good water quality range throughout the last year except once over when it just slipped into Moderate during February.

It has consistently scored low ammonia but nitrate is highly variable.. ranging from 68.0ppm in June to 0.9ppm this month. Similarly, Wallace Brook near Reigate records low phosphate and low nitrate but very high ammonia. This is probably associated with runoff from nearby horse stables.


Perhaps surprisingly Bewbush Brook which drains to the south west of Crawley from hills in Holmbush Forest and Buchan Country Park, averages some of the highest water quality in the catchment at just 0.06ppm phosphate over the 15 months of testing. It may not be the most likely contender for highest water quality as new housing, a major road, legacy landfill and some forest land use would usually be considered as risks to water quality but at least from phosphate this test site consistently rates as high quality.


The relatively High quality of streams like Bewbush Brook can be seen in the chart below as the low bars on the far left hand side. This tributary is in the upper reaches in the far south west of the River Mole catchment and rises from woodland in permeable sandy Hastings Beds largely upstream of urban, agricultural or industrial land uses.

Somewhat counter to our arguments though there is one sewage treatment plant at the head of the stream called Colgate but it is small and there have been no storm overflows since January and February this year (see bar far left below).

Nevertheless, the quality of this stream is somewhat of a welcome surprise and worth further investigation as a counter to our preconceptions of what causes pollution in the catchment. It could be that the excellent conservation work at the Buchan Country Park has improved overall runoff, storage and hydrology in the in the wooded slopes and lakes that supply tributaries in the wider stream network.

The wider catchment view
The chart below shows every test site in downstream order for the entire test period so far including winter. The blue bars show the generally lower test results in winter due to diultion from higher river discharge. Several red bars in the middle section of the Mole go to the "top" of our range at 2.50ppm which is into Bad water quality status. It is worth considering that many of these tests exceeded the range of the Hanna low range phosphate kits so it is likely that dilution testing would have shown levels considerably higher than even 2.50ppm. This was shown on our Leigh Brook focus study where dilution tests and specialist EA kit showed phosphate levels as high as 15ppm! Note also the extremely persistent levels of phosphate that continue well downstream into Fetcham and Cobham and the Lower Mole. These are all damaging levels and well into the Poor water quality status which starts at 0.50ppm.

Overall levels of phosphate are the worst we have recorded in the catchment with 82% in the moderate, poor or bad water quality range this month.


Our long term running mean for the catchment shown above is similarly bad news with nearly 80% of tests in the moderate-poor and bad range for the entire period of the last 15 months. The frequency histogram below also shows that the vast majority of tests our volunteers carry out return results that are moderate, poor or bad water quality. Only 20% are rated Good or High. Remember the aim of the Water Framework Directive was to get all rivers to Good status by 2027?! These results show our local River Mole going in the opposite direction.
The Government is not on track to meet the Water Framework Directive requirement—subsequently transposed into UK law—for all rivers to reach Good status by 2027 .2027

Here is a reminder of what high levels of phosphate means for aquatic life but also for wider ecosystems surrounding the river and ultimately for human health and well being? Excessive amounts derived from fertilisers and sewage discharges cause eutrophication
and reduced dissolved oxygen concentrations.

In this section we have focussed on Bad water quality in streams and some that are Good or even High water quality. Of course, our statistics show that most of our waters still test Poor or Moderate but this is also completely unacceptable in terms of where we should be at for healthy rivers.


Nitrate: wide ranging polarised results
Our nitrate results tend to be highly polarised and fluctuate between extremes at some sites or between nearby sites. For example, Redhill Brook has tested relatively low for nitrate while Salfords Stream, into which it flows, has seen some high spikes in nitrate.

It is also noticeable that results that nitrate levels in some smaller streams tend to be polarised at either one end of the scale or the other. Big changes in height of the bars in the chart below for tributaries such as Tanner's Brook, Baldhorn's Brook, Spencer's Gill and Salfords Stream in the Upper Mole illustrate these erratic nitrate test results. The fluctuating nature of results perhaps indicates flushes of nutrients into these streams at times. It is noticeable that several rural streams such as Shag Brook, The Rye, Spencer's Gill and Baldhorn's Brook had spikes in nitrate in June. It is difficult to make sense of these results without more detailed analysis of active land use.
The exception to the erratic behaviour is Earlswood Brook which has returned relatively high nitrate levels throughout the first three months of testing. This might be linked to the sewage treatment works upstream.

Nitrate levels in larger tributaries and the main River Mole channel appear to be generally higher and somewhat more stable than smaller tributaries as can be seen at locations such as West Vale and Sidlow in the Upper Mole. Nevertheless, even here there can be considerable changes each month.
Nitrate (NO3-) is an essential nutrient for aquatic organisms however excessive amounts from agricultural run-off and sewage effluent can be highly damaging to the ecology of rivers. Excessive nitrate can cause algal blooms and reductions in dissolved oxygen concentrations. The GIS map below shows that nitrate continues to test at worryingly high levels upstream and through the Mole Gap.

July nitrate levels also continued to be significantly higher at test sites on tributaries with sewage treatment plants upstream.

Overall, 60% of water courses in the Mole catchment were classified as moderate poor or bad in terms of nitrate levels.

Ammonia: highlights special pollution problems
Ammonia levels seem to be particularly high on certain rural streams such as Spencer's Gill in Hookwood and Wallace Brook near Reigate. Both of these have distinctive rural land uses and ammonia tests may well be useful in highlighting issues arising from these. Wallace Brook for example has horse stables where the runoff into the river has been an issue and might be a cause of the elevated levels.

Completely counter to phosphate and nitrate results, our tests for ammonia show that streams with sewage treatment works have lower ammonia levels than those streams without sewage treatment works. Our citizen scientist team includes a number of ex-Thames Water employees who have been able to tell us that STWs are more effective at reducing ammonia in hot weather. This might explain the lower readings in streams with STWs than those without. It may also support our findings that show those spikes in ammonia on rural streams. Here are further details provided by our expert volunteers from the industry..
Streams with STW discharges may show lower overall ammonia levels as they have a significant proportion of flow contribution as effluent during dry weather when other streams are drying up so have less dilution. STW effluent is usually lower in ammonia during warm weather, unless there are power supply or mechanical maintenance issues. Any ammonia contribution into streams from farms and stables will be more concentrated during warm dry weather as there is no rain for dilution and the bacterial activity in dung heaps or slurry ponds will be more rapid releasing more urea and ammonia after degradation.

As usual we are still a way off "proving" any sources of pollution in the field but we are bringing things into focus more each month as we gather more data and more knowledge and experience about our catchment. For example, we have been out on field days with partners to test on single tributaries which is helpful in finding and "zooming in" on problems. This is great fun and rewarding work but necessarily labour intensive and time consuming.

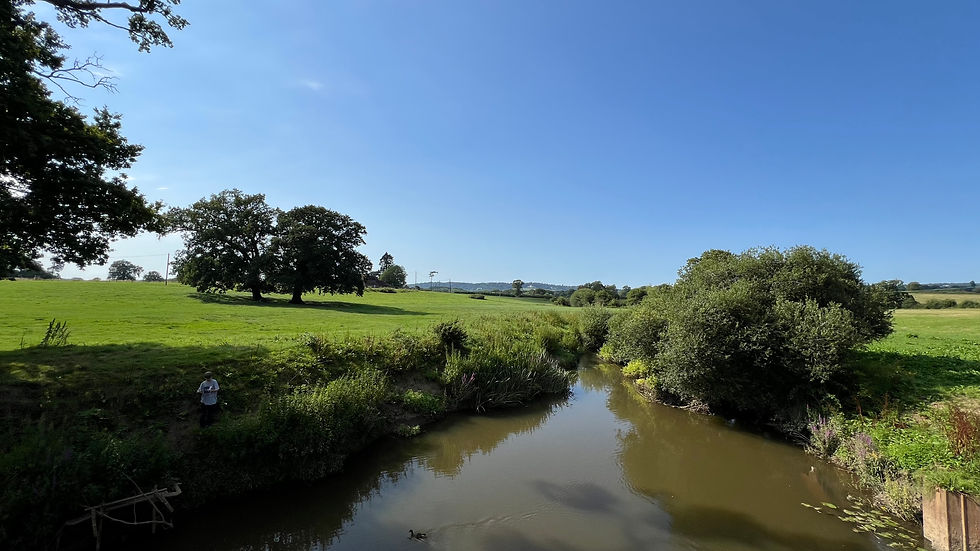
Finally, there is always so much to report.. this is just a snap shot of activities, findings and data this month. Here is a photo of the River Mole at Flanchford Bridge where we tested on the Leigh Brook testing day. Can you spot the lad fishing? We briefly chatted to him and he wanted to tell us what he had caught. Happily he was catching a variety of small fish and enjoying the outdoors as much as previous generations have done. It's good to know the river still provides this sort of fun and activity for new generations. Our job is make sure that it continues to do so when it is so hard pressed.
Thank you for so much for reading this post. If you like our work please consider donating by finding the donate button on this page!
Thank you!
Advice from Rivers Trust: Waterborne diseases
Working (or playing) near water is a potential source of disease including leptospirosis or Weil’s disease, hepatitis A and tetanus. In all cases the best preventative measures are:
Be aware of where and how these diseases can be caught and take precautions based on this knowledge.
Ensure tetanus jabs are up to date.
Ensure that any cuts on hands are covered with waterproof plasters, and carefully clean and cover any cuts or grazes that occur whilst working in water.
Wear protective clothing such as gloves.
Avoid ingestion of water.
Ensure that hands are washed after contact with water especially before eating, drinking or smoking.
If you have accidentally entered the water, wash thoroughly and as soon as possible.
If feeling unwell after taking part in the survey, seek medical attention and notify them of the activities you have undertaken.


Comments