

River Mole River Watch: January 2025 pollution test results update
- Feb 12
- 7 min read
In late January, citizen scientists from the River Mole River Watch conducted their monthly water quality assessments to evaluate pollution levels at 32 designated sites throughout the catchment area. The sampling locations were strategically selected on each tributary, closest to their confluences, as well as at multiple points along the main channel to monitor variations in water quality downstream. Over the past two years, a substantial dataset has been collected, facilitating comprehensive analysis of patterns and correlations. The following is a summary of some key findings for January 2025.

Phosphate
At 0.37ppm the average catchment phosphate concentration in January was the second lowest we have recorded over 2 years of data collection, just above 0.29ppm in March 2024.

Unusually low phosphate levels were recorded along the Horley stretches of the Upper Mole and Gatwick Stream Riverside to Sidlow Bridge, all these sites on the main River Mole were in the Good range of water quality status. This is the first time Sidlow Bridge, usually Moderate or Poor, has tested Good status. The average of these sites through last winter was Moderate.

The familiar seasonal trend has continued with a continued winter reduction in phosphate concentration correlating with the rise in river discharge particularly during the weekend of our test.

As was seen last winter, the Upper Mole shows the strongest seasonal response with levels falling relatively more than in the Lower Mole. In January, average phosphate levels for Upper Mole test sites declined below those in the Lower Mole.

In January, phosphate concentrations in the Upper Mole averaged 0.23 ppm, while downstream in the Lower Mole, levels were notably higher at 0.50 ppm. This spatial disparity between different parts of the catchment undergoes a seasonal reversal during the summer months, with the Upper Mole exhibiting significantly elevated phosphate levels compared to the Lower Mole. Interestingly, during winter, the Lower Mole retains higher phosphate concentrations relative to the rest of the catchment, even despite dilution effects. This trend is evident in the chart below, where the purple line (representing the Lower Mole) fluctuates above and below the green line (Upper Mole) through the winter period.
The overall observed pattern in winter — strongly declining phosphate levels in the Upper Mole alongside sustained concentrations in the Lower Mole—was particularly pronounced in water quality tests conducted this January, highlighting a clear seasonal and spatial variability in phosphate dynamics across the catchment.

Test sites with sewage works upstream continue to exhibit higher phosphate concentrations than those which do not have major sewage treatment works. For this comparison we are only considering the presence of the 9 large sewage treatment works and not sewer overflows, pumping stations or misconnections which may have an impact but are harder to quantify as sources of phosphate.


There are 307 sewage pumping stations serving the Mole catchment and only 18 have Event Duration Monitors (EDM) installed so there is no information on sewage spills. This makes quantifying their impact hard. Indeed, many like Leigh Bridge SPS, do not have overflows at all but likely cause sewage to surcharge from flooded sewers into streets and down ditches into streams during times of high rainfall. The failure of pumping stations to cope with flows suggests they are linked to local sewage flooding. This is a common problem in the catchment in numerous places. One recent example was at Castle Drive SPS in Reigate (map shown above). Heavy rain in Autumn caused sewage to overwhelm the pumping station and flow into a local stream. Locals reported fish deaths. Similar issues frequently occur elsewhere in the sewer network as pumping stations fail to cope with the volume. Thames Water have started taking pre-emptive action. Prior to forecast heavy rain in late January, Thames Water placed Lanes teams ready to pump at numerous known spill sites.

For those pumping stations with event duration monitors installed it is very concerning to see a rise in storm overflows in recent years as shown in the chart above. Several of these have seen an annual compound growth rate of more than 50% storm overflows and IronsBottom (which is pumping station and small treatment works) has seen over 900% annual growth rate since 2022. These are not welcome statistics.

Downstream trends in phosphate levels above show thicker blue bars for our January 2025 test results. The climb in January phosphate levels into the Lower Mole is noticeable.
Whilst levels are lower than summer, over 60% of sites still fall into the Moderate and Poor water quality status causing potential harm to aquatic ecosystems.

Long term results show that nearly 80% of tests in the Mole catchment fall into the Moderate-Poor-Bad status.

Our citizen science photos of water courses show that appearances can be deceptive in making judgements about water quality. Some streams testing Good or even High water quality in January were full of silt and, while their milky appearance may look polluted, the tests say otherwise.


A comparative analysis of water quality test results between January 2025 and January 2024 reveals a weaker correlation than previous comparisons such as December 2024 versus December 2025. The January data exhibits three significant anomalies, indicating divergent trends between the two sampling periods. This discrepancy challenges the initial assumption that seasonal water quality conditions in the same month would remain reasonably consistent year-over-year. Cross-validation and verification confirm the integrity of these anomalous data points, likely ruling out measurement or procedural errors. Instead, the anomalies likely reflect genuine fluctuations in phosphate concentrations. For instance, Gad Brook recorded a concentration of 0.21 ppm (classified as Moderate) in January 2024, which increased markedly to 0.91 ppm (classified as Poor) in January 2025. This represents a 333% increase in concentration, which is more typical of summer readings for this site than expected winter values. We endeavour to validate anomalous data points, at least by desk-based investigations, as part of ongoing data collection to ensure robust interpretation of trends.

Nitrate
Nitrate levels do not correlate well with phosphate. Some streams may return "High" water quality (meaning low concentration) for one test but "Poor or Bad" water quality status for another test.

Patterns of nitrate concentration are more polarised than phosphate. More nitrate results tend to fall into the Poor or Bad water quality status. Even in January, 42% of sites exhibited Poor or Bad water quality related to nitrate concentration while only 21% of sites were Poor or Bad regarding their phosphate concentration.

Earlswood Brook consistently returns by far the highest nitrate concentration in the catchment with an average of 85.2ppm from 9 months of testing. Whilst other streams such as Leigh Brook, Salfords Stream and Burstow Stream at Lake Lane also average Bad status but their concentration is usually lower than Earlswood Brook.


For January tests, Salfords Stream returned just 0.4ppm which is in the High status water quality category and Burstow Lake Lane returned just 6.3ppm Moderate status, both unusually low nitrate concentrations for these locations. Burstow Stream, Leigh Brook and Earlswood Brook also exhibit much larger fluctuations in nitrate results than any other water bodies in the Upper Mole catchment with deviation around the mean 32, 20 and 26 ppm respectively. These three sites have sewage treatment works in close proximity to test sites just downstream. This compares to single digit deviation for other streams in the Upper Mole.

It is found that those sites with sewage treatment works upstream not only have much higher nitrate concentrations but also experience larger deviations around the mean than those without, this range is partly shown in the chart.

While geographic patterns of nitrate levels follow previous months, January downstream trends in nitrate levels are less defined than usual with considerable fluctuation between adjacent sites downstream. For example, Gatwick Stream Riverside Horley tested 29.4 ppm Bad WQ while a few km downstream in West Vale nitrate concentration was tested Good WQ at 2.5 ppm.


A similar anomalous local variation occurred along the Dorking stretch of the River Mole with Castle Mill testing 18.3ppm Bad WQ while downstream at Stepping Stones tested just 5.3ppm Moderate WQ. For the Stepping Stones site this result is anomalously low, not least as it is just downstream of the outfall at Dorking (Pixham) sewage treatment works. As shown in the chart below nitrate concentration for the Stepping Stones has been consistently higher than upstream at Castle Mill until recent months. This reversal of concentration levels downstream might turn out to be a seasonal winter pattern.

It's worth noting that nitrate concentrations downstream through the Mole Gap to Fetcham Splash are also somewhat lower for January than average. Downstream of Fetcham, the Lower Mole exhibits consistently Bad nitrate water quality all the way to the Ember and Molesey sites, while phosphate levels are Poor.

Similar to phosphate, nitrate concentration has a strong correlation with river discharge.


Seasonal changes in nitrate concentration are following similar patterns to phosphate and follow river flow quite closely.

Catchment nitrate levels levels continue to show over 60% of sites exhibiting moderate, poor or bad water quality.

Other test updates
Ammonia concentration continues to show a strong decline downstream.

For the first time, January tests shows streams with sewage treatment works upstream with higher ammonia concentration than those without.

Wallace Brook, Reigate continues to stand out as the tributary with by far the highest concentration of ammonia but Spencers Gill and Hookwood Common Brook also show elevated levels at times. Burstow also has somewhat elevated ammonia. These are rural sub-catchments.

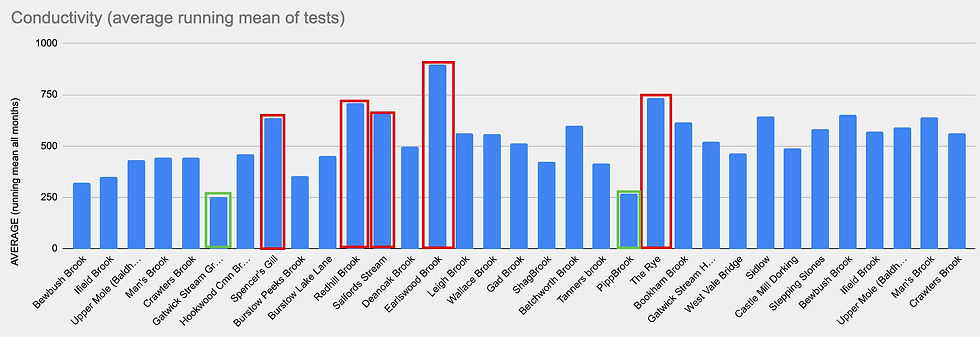
Conductivity, averages shown below, is starting to show consistent patterns. Streams with higher levels are Earlswood Brook, Redhill Brook, Salfords Stream, Spencers Gill and The Rye. Pipp Brook and Gatwick Stream Grattons Park exhibit notably low conductivity.
These reports are only summaries of our test results and growing database of water quality across the catchment.
Thank you so much for reading. Please leave a like and do add a helpful comment.
Comments