
Summary
River Mole River Watch citizen scientists have gathered enormous amounts of water quality data across the River Mole catchment, allowing us to identify the most polluted streams in the region. Our analysis, based on a weighted combination of phosphate, nitrate, ammonia, and conductivity test results, shows that Leigh Brook ranks as the most polluted stream in the catchment. With extremely high phosphate and ammonia levels, especially near the Holmwood Sewage Treatment Works (STW), the stream falls into the "Bad" water quality class, suggesting critical harm to aquatic life. Despite its rural catchment, Leigh Brook exhibits pollution far worse than its neighbouring streams, pointing to both sewage effluent and possibly local agricultural or landfill-related sources. This post presents our findings, explores the key pollution hotspots, and suggests further investigation into additional potential sources of contamination.

Leigh Brook: Most Polluted
With sixteen months of data, we are now able to rank order streams in the Mole Catchment to identify the most polluted streams. Below is our "Premier League Pollution Table" which was compiled based on the combined monthly test results for phosphate, nitrate, and ammonia levels, as well as conductivity. The results of each test were assigned weights based on their impact on aquatic health, the volume of available data, and an evaluation of their reliability. Phosphate levels were given the highest weight of 70%, while the other tests were each assigned a weight of 10%. Even with significant adjustments to weights, the rank order remains stable especially at the extremes. This ranking may change over time but is a useful snapshot of water quality conditions across the catchment.

Our results show that Leigh Brook ranks as one of most polluted stream in the River Mole catchment. Leigh Brook consistently returns high phosphate readings well into the Bad water quality class. To further our understanding we recently conducted a detailed survey of the stream which showed damaging levels of toxic ammonia as well as phosphate and nitrate coupled in some places with low oxygen saturation.

Leigh Brook is a small stream rising from springs in Redlands Wood and around Anstiebury Farm. The source springs rise from a substantial 200m ridge forming the eastern flank of Leith Hill. The Lower Greensand ridge drops over 100m to the impermeable Weald Clay basin which comprises most of the Upper Mole catchment. The impermeable nature of Weald Clay means stream levels rise and fall quickly. Whilst this means that streams can flood easily due to rapid surface runoff, they can also dry up readily in dry spells due to a lack of reliable natural baseflow.

Two tributaries form separate arms of the upper course of Leigh Brook which meet at Ewood Farm. The northern tributary flows under the A24 and across farmland bounding the southern edge of Holmwood Common.

This arm of Leigh Brook flows directly around Holmwood Sewage Treatment Works (STW). The sewage works continuously discharges treated effluent directly into the stream as well as a separate storm overflow. Holmwood STW has one of the poorest performance records of any of the 9 major sewage treatment works in the Mole catchment.

Not only is Holmwood STW rated as a "site of concern", it is also one of the 26 Most Polluting works in the Thames catchment and has the worst record for duration of storm overflows in the Mole catchment averaging 1500 hours a year of untreated raw sewage discharges into the Leigh Brook. Already this year to September 2024 it has spilled over 1000 hours of storm overflows into the brook.

The EA catchment data explorer rates the Leigh Brook Poor and provides numerous Reasons for Not Achieving Good all of which relate to sewage discharge. This means the finger points officially at Holmwood Sewage Works for the woeful state of this stream.

The Leigh Brook continues downstream from Holmwood through rural agricultural land. A short downstream from the sewage treatment works is a disused landfill site. Whilst there appears to be heavy machinery traffic using the lanes the piles of waste are old and the EA confirms it is no longer used. The Lower Course of Leigh Brook passes through mixed farmland including cattle grazing and crops, a few farm hamlets at Ewood and Brook Farm and then past Leigh village itself before another few km to the join the River Mole near Moon Hall just upstream of Flanchford Bridge.

With such a rural catchment Leigh Brook ought be one of the cleanest rivers in the Mole catchment so it is a scandal and a tragedy that it is more or less dead ecologically. Gad Brook and Deanoak Brook are its' immediate neighbours and feature similar land use but are consistently higher quality. They both sit mid-table in our pollution rank hovering on the threshold between Moderate and Poor water quality. Whilst Gad and Deanoak Brooks are still unacceptable, Leigh Brook is consistently "off the scale" Bad. The map below shows the August monthly phosphate ppm data. Note Gad Brook was dry for the August test, in July it was rated Poor for WQ.

Our monthly Leigh Brook test site is where the stream flows past Leigh Village under Leigh Bridge. Where we find polluted streams, one of our aims in River Mole River Watch is to further investigate and try to identify key sources of pollution upstream. Despite Holmwood STW being the significant contributor to water pollution, our research and community insights strongly suggest that it may not be the sole source of pollution affecting the Leigh Brook. To find out more, we tested the entire length of the stream.

Testing the Leigh Brook: 7 Sites
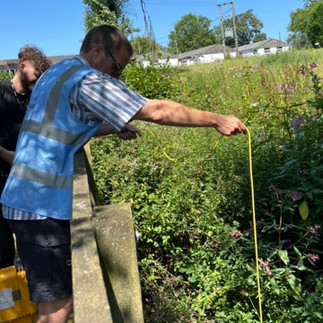
In late July Nigel Bond and I organised a detailed downstream pollution survey of the Leigh Brook with our Mole catchment partnership officer Josh Hammond from the Environment Agency and our partners from South East Rivers Trust, Dr Lewis Campbell, and our own Trustee Prof Jess Neumann from Reading University. We are extremely fortunate to have this help and support from the EA and SERT and Reading Uni because they bring technical expertise which is so useful in combination with our own tests and knowledge of the catchment to produce a comprehensive survey of water quality.

Nigel and I are enormously grateful to Josh, Lewis and Jess for their ongoing help.
On the day we conducted a raft of tests and observations at regular points downstream from near the source to the confluence with the River Mole just upstream of Flanchford Bridge.

The 7 test sites included up and downstream of Holmwood STW as well as at key farm locations downstream and at Leigh village itself. The final test was conducted at Flanchford Bridge just downstream of where the Leigh Brook enters the River Mole. The tests were carried out on 29 July, a sunny and hot day.


Our water quality tests confirmed that Leigh Brook is severely contaminated, to the extent that in certain areas it is highly likely to be "ecologically dead" for wildlife. Although we did not conduct invertebrate testing on this occasion, the results from a range of chemical and other tests showed unexpected variations across different test sites. The discharge from Holmwood Sewage Works caused an alarming pollution peak, but what also concerned us was the spikes in pollution levels observed at various downstream locations, indicating the presence of other significant pollution sources.
The following tests were conducted at each site:
Ammonia Nitrogen (NH₃-N)
Ammonia is highly toxic to aquatic life even at low concentrations. Ammonia Nitrogen becomes especially toxic to aquatic life including fish above 0.02 - 0.05 mg/L for long-term exposure (depending on pH and temperature). Acute toxicity may occur above 0.2 mg/L.
Ammonium Nitrogen (NH₄⁺-N)
Less toxic than ammonia but still indicates nitrogen pollution, contributing to ecosystem stress. Higher temps and higher pH (i.e more alkaline water conditions) drives conversion of ammonium NH₄⁺-N to the more toxic ammonia NH₃-N. High levels of both are therefore of potential concern and both results are presented here.
Phosphate (PO₄³⁻)
Phosphate contributes to eutrophication and algal blooms, which can significantly degrade water quality. The Water Framework Directive thresholds for water quality status are outlined below.

Nitrate (NO₃⁻)
High nitrate levels contribute to nutrient pollution, though generally less immediately toxic than ammonia. Concentrations above 10 mg/L can lead to eutrophication (excessive nutrient enrichment) and harm aquatic life.
Conductivity
Indicates the presence of dissolved ions (salts, metals, etc.), which can signal pollution from sewage outfalls and runoff containing metals and road salts.
Dissolved Oxygen Saturation (%)
Is key for assessing the stream’s ability to support aquatic life. Low oxygen levels are critical for aquatic life but are often a result of nutrient pollution rather than a direct pollutant.
Dissolved Oxygen Concentration (mg/L)
Oxygen concentration it reflects the impact of pollutants rather than being a direct measure of contamination.
pH Levels:
Aquatic life prefers water with pH between 6.5 and 8.5. Outside this range, may signal pollution issues.
Salinity:
Salinity was measured in PSU (Practical Salinity Units). This is dimensionless and represents salinity in a manner similar to parts per thousand (ppt). All of our results fell into the range for "Normal Fresh Water" which is typically a salinity of **0.0 to 0.5 PSU. Elevated risk starts above 0.5 PSU and Severe Risk of harm to freshwater organisms is salinity levels above 1.0 PSU. This may signal a severe pollution issue.
Water Quality Test Results site by site
Antecedent conditions: The test day was sunny, hot and dry. Although July was a relatively wet month at over 80mm (Charlwood 148% of LTA rainfall), the end of July was mostly dry.

In fact there had been no rain at all in the 3 days prior to our test day which meant river levels were low. Indeed, the neighbouring Gad Brook stream was completely dry, a point worth remembering as we now go through the results starting at Site 1 and proceeding downstream to the confluence with the River Mole at Site 7.

Site 1: South Holmwood Village: A Poor start and things would only get worse
Our Leigh Brook test day started at South Holmwood which was the most accessible site to gather data upstream and not too far from the sources in Redlands Wood.

The first test site at South Holmwood village just west of the A24 had low stream levels with a "pond" of water at a road culvert with almost no flow as shown below.

A visual inspection further upstream showed channels were dry or with just a trickle between isolated pools in streams flowing out of Redlands Wood as shown in the photo below.

The table of data below shows a summary of our main test results. Despite the tests at South Holmwood showing the lowest overall pollution and "highest" water quality, the phosphate value of 0.54ppm places this around the threshold between Moderate and Poor water quality class. A number of properties with grazing fields and horse stables exist upstream which could contribute to raised levels of phosphate.

The Moderate/Poor quality at Site 1 may also have related to the lack of flow so that even visits from dogs wanting to cool off could cause phosphate or ammonia concentration to tick up (full transparency: mine did on the recce day!). In any case, sadly water quality would get a lot worse downstream. We did not undertake all tests at Site 1 but limited tests to the Hanna kits which were sufficient to get a snapshot of water quality at this upstream site.
Site 2: Holmwood STW outfall: TOXIC levels of Ammonia harmful to life

We had to battle through significant undergrowth to reach the second test site at the treated outfall at Holmwood STW. There was no significant flow from upstream so the "waterfall" of treated effluent cascading out of the sewage works into the stream formed 100% of the flow in this part of Leigh Brook. There was little odour apart from that generally issuing from the STW behind the fence but plenty of foam in the stream as seen in the photograph above taken on the day. The water was clear but we saw no signs of fish or other aquatic life except for one frog seen hopping away from the water.

The results at the Site 2 showed toxic levels of ammoniacal nitrogen at 0.06 NH₃-N mg/l.

The charts above show that Site 2 at Holmwood STW outfall had by far the highest test results on the Leigh Brook for ammoniacal nitrogen and ammonia concentration. These are both well over the threshold for acute toxicity and therefore risk critical harm to aquatic life. These scores raise the question as to whether Holmwood STW is discharging wastewater within permit levels and whether the permit levels are adequate and fit for purpose. We are currently investigating whether these scores indicate a breach of permit.

Downstream of Holmwood STW, ammonia nitrogen and ammonia both fell away steeply to the lowest test result at Ewood Lane. Ammonia Nitrogen then climbed again to another critical peak of 0.05 NH₃-N mg/l at Leigh Village which also saw the highest levels of nitrate concentration (see below). These spikes may be associated with the Sewage Pumping Station at Leigh Bridge (shown below) which has been causing sewage flooding at locations in the village and from manholes directly adjacent to the stream.


Thames Water do not yet have an EDM on this pumping station so data is not easily available on its performance. However, there is evidence of surcharging and spilling at the surface in places near the brook so we are endeavouring to find information on how overflows during outages at the SPS may impact the stream.

Conductivity test results shown above were highest at Site 2 with specific conductivity reaching a high of 926 µS at the STW outfall site. Higher conductivity often signals higher pollution levels, especially salts or chemicals from wastewater or road runoff. In this case, it seems likely that treated effluent from Holmwood STW was causing the surge in conductivity from Site 1 to 2. Thereafter, levels remained high but gradually fell to a low point at Moon Hall just before the Leigh Brook joins the River Mole. Interestingly, conductivity rose to another high peak at Flanchford Bridge.

Reasons for the spike in conductivity in the main River Mole might be the high proportion of effluent that comprises the river from sewage treatment works upstream at Horley and Crawley. Over 60% of the Upper Mole during low flow can be comprised of treated effluent as shown by the model above showing the estimated proportion of effluent on 18 August during our E.coli testing week. At low river levels there is a higher proportion of effluent making up the river flow which exacerbates pollution concentration with less dilution from rainwater runoff augmenting river flow. Both spikes in conductivity and nitrate levels may reflect the impact of effluent.
Site 3: Ewood Lane: Peak Phosphate!
Tests at Site 3 on Ewood Lane showed a shocking spike in phosphate at 15.4 ppm, the highest we recorded which even exceeded levels at Holmwood STW outfall. Indeed, this is by far the highest phosphate reading we have yet seen in the catchment over 16 months of testing at more than 30 sites.
To obtain a readout as high as this on our Hanna Low Range phosphate checkers involved appropriate dilution of each sample with distilled water. Dilution was required because all but one of our tests would have exceeded the maximum reading of 2.50ppm and we were interested in finding the actual level of phosphate concentration rather than simply all results being "greater than 2.50ppm".


We have made some investigations into potential causes of this enormous spike in phosphate in the area around Ewood Lane and onwards to Brook Farm. This is a rural farming area so the cause may be diffuse legacy phosphate leaching from agricultural soils. There is also a landfill site upstream with an adjacent lake. On request the EA conducted a site visit to the landfill and confirmed their records which stated it was disused. However, it might be that old waste could still be leaching material into the nearby stream and the nearby "odd coloured lake".

Investigations into local sources of phosphate continue but it may prove challenging to pin-down diffuse sources such as leaching of legacy phosphate from the soil or point sources such as misconnections or leaking septic tanks. Whatever the source turns out to be, this level of phosphate concentration is highly concerning and places Leigh Brook well into the Bad water quality class in the Water Framework Directive.

High phosphate levels can cause eutrophication and algal blooms which can lead to depleted oxygen levels. It was no surprise therefore to see Ewood Lane also had the lowest readings for both dissolved oxygen 4.97mg/l and oxygen saturation 53.1%. Oxygen saturation below 60% saturation indicates Severe Oxygen depletion where many species will experience stress and death. In addition, dissolved oxygen concentration between 3-5 mg/L is stressful for some sensitive species and prolonged exposure can negatively impact fish health, growth, and reproduction. Whilst no dead fish were seen, we also didn't see any fish either.
The correlation between high phosphate and low oxygen saturation at Ewood Lane suggested potentially serious eutrophication in the Leigh Brook. Oxygen levels did recover downstream to reach an optimal level over 80% by Leigh village. However, phosphate levels remained high and other pollutants appeared to increase.
Site 4: Brook Farm : a steady climb in nitrate
Brook Farm showed a continuation of a climb in nitrate levels from a low point at Ewood Lane through to Leigh village.

The chart below shows nitrate levels climbing to 32.5 ppm at Brook Farm. A possible source of nitrate in the stream at this site is from agricultural runoff from fertilisers during rainfall. However, nitrate can also enter in treated effluent discharging from upstream, most likely from Holmwood STW.

Contaminants may also arrive from other consented discharges and overflows from septic tanks and other sewage discharge systems upstream. It seems possible that a spectrum of sources could be contributing to the rising nitrate between Ewood Lane, Brook Farm and then to Leigh village itself.

For example, the map below shows there are at least 4 consented discharges registered by the EA in addition to the outfalls at Holmwood STW upstream. These discharge sites are located near Beare Green, Holmwood and Henfold Lakes. The relative contribution of nitrate from different sewage and agricultural sources might explain the fluctuations in nitrate levels downstream along Leigh Brook.

Although the consented discharge locations shown above do not perfectly align with variations in nitrate levels, further fieldwork investigation may pinpoint further misconnections or other sources that could account for the fluctuations. As already mentioned, the Sewage Pumping Station (SPS) at Leigh Bridge is a suspected source of pollution that may account for the increased nitrate at that site. Evidence of sewage overflows from manholes near the stream suggests this pumping station has a concerning performance record. Unfortunately there is no EDM operating at the Leigh SPS so there is no way of easily monitoring its overflows and it does not appear on the map of consented discharges above. We are raising the status of Leigh SPS with Thames Water.

Considerable variations with spikes in nitrate associated with STW outfalls also occur in our catchment-wide monthly tests on the River Mole, as shown in the map above of August 2024 nitrate results. Results show that nitrate levels increase downstream of large STW sewage outfalls. The considerable fluctuations on the Leigh Brook at a smaller geographical scale reflect this wider pattern and so demand further investigation.

Site 5: Leigh Village: high Nitrate and Ammonia Nitrogen!
The chart below shows that Leigh Bridge just outside the village centre had concerning levels of toxic ammonia nitrogen.
At 0.05 NH₃-N mg/l the test site at Leigh village had the second highest level of ammonia nitrogen after the Holmwood sewage effluent discharge site.
At 53.6 ppm we also measured the highest nitrate concentration on the Leigh Brook. Furthermore, with phosphate at 8.30 ppm, this stretch of stream is firmly in the Bad water quality class.


Our regular monthly tests had originally alerted concerns about this stream because most results were "off the scale" indicating over 2:50 ppm phosphate in undiluted tests. Even in wet weather, which tends to dilute pollution concentration levels, the stream never improved beyond Poor water quality status.
However, to add balance to our data analysis we should mention that dissolved oxygen reached peak levels of 85.6% DO and 8.13mg/l oxygen saturation at Leigh Bridge both of which indicate an improvement in the stream’s ability to support aquatic life. Nevertheless, the other indicators are still very poor and the overall status equates to Bad WQ on the Water Framework Directive scale.

Site 6 and 7: Moon Hall and confluence with the River Mole
The Leigh Brook at Moon Hall was in poor condition with slow flow and beige scum collecting around woody debris in the channel. A somewhat sad end to the challenging journey of our stream.


At 6.60 ppm and 0.04 NH₃-N mg/l respectively, phosphate and ammonia nitrogen levels remained high and damaging. Nitrogen concentration fell to 15.5 ppm but it was noted that this may have been due to some reagent loss during the test procedure. We didn't have time to repeat this one.


Our final test at Flanchford Bridge was in the main channel of the River Mole and was conducted to compare values with Leigh Brook. The charts above show that some test results increased in the main River Mole channel with nitrate at its highest level of all the sites. It is notable that phosphate concentration improved for the first time since Site 1 moving from Bad to Poor water quality class. On a positive note you might spot the boy fishing in the photograph below. We were delighted to hear he was catching some fish!

By aggregating all pollutants and assigning weights based on their significance in influencing water quality, the chart below reveals that the most heavily polluted location along the Leigh Brook is, as expected, the Holmwood STW outfall at Site 2.

Conclusions
Our water quality test results for Leigh Brook highlight several important findings. Damaging levels of ammoniacal nitrogen (NH₃) and other pollutants such as nitrates and phosphates were detected at various points along the stream. Elevated levels were very likely caused by sewage discharge at Holmwood STW but also by possible agricultural runoff, other consented sewage discharges, possible runoff from landfill and other as yet unidentified pollution sources. Dissolved oxygen levels were at dangerously low levels at Holmwood STW but recovered to safer thresholds downstream, albeit showing slight variability.
Overall, Leigh Brook is highly polluted and sits stubbornly in the Bad water quality class. There are signs of damaging localised pollution in places, especially with respect to nutrient overload and ammoniacal nitrogen associated with effluent discharge from Holmwood STW. We will continue our investigation into other possible causes as well as continue our monthly testing to monitoring any worsening of conditions. We are also addressing the concerning issue of inadequate effluent treatment at Holmwood STW with Thames Water, as well as highlighting the underperforming Leigh SPS.
Thank you to our excellent team for a rewarding and fascinating day, despite the continuous reminder from our data of the stream's dreadful condition.

If you find our work helpful then please consider making a donation by using the button on this website.
Please also Like this post and feel free to comment below.
Many thanks for reading our account on Leigh Brook.
Comments